Airtable Gantt Chart: Export and Print Guide
Prepare an Airtable Gantt chart for a readable report: check dates, choose a CSV task table or separate timeline, and inspect the final printed output.
You cannot directly print an Airtable Gantt chart using a native Gantt print command. Airtable's own FAQ instead points to CSV export and printable layouts, so first decide whether you need a data table, a visual schedule, or a live shared timeline. Airtable Gantt documentation.
Key Takeaways:
- CSV preserves exported data, not the visual bars and dependency arrows of your Gantt view.
- A readable printed schedule needs an explicit date window, selected tasks, and a clear revision date.
- Test the required output before migrating from Notion or another project tool just to obtain printing.
- Keep the operational schedule separate from its reporting snapshot, with enough references to reconcile the two.
Define what the printed schedule must communicate
A printed schedule can serve several different jobs. A client may need a milestone overview. A working team may need the next week's assignments. A project review may need the full dependency chain. Trying to fit all three onto one page usually creates an unreadable result.
Start by writing the audience, date window, and decisions the document should support. If the reader needs to know which tasks start next week, include those tasks and the relevant blockers. If the reader needs to approve a major deadline, a milestone summary may be more useful than every internal task.
Choose the required output format before touching the base. A printable task table is simpler than a graphical Gantt chart. A PDF can be convenient for distribution, but it is still a static snapshot. If the reader needs the latest schedule whenever they open it, a suitable shared view may be the better delivery format.
The source research includes a community discussion about moving from Notion to Airtable partly because of Gantt printing. That is a real buying concern, but it does not establish that the destination product provides the missing output. Read the migration question.
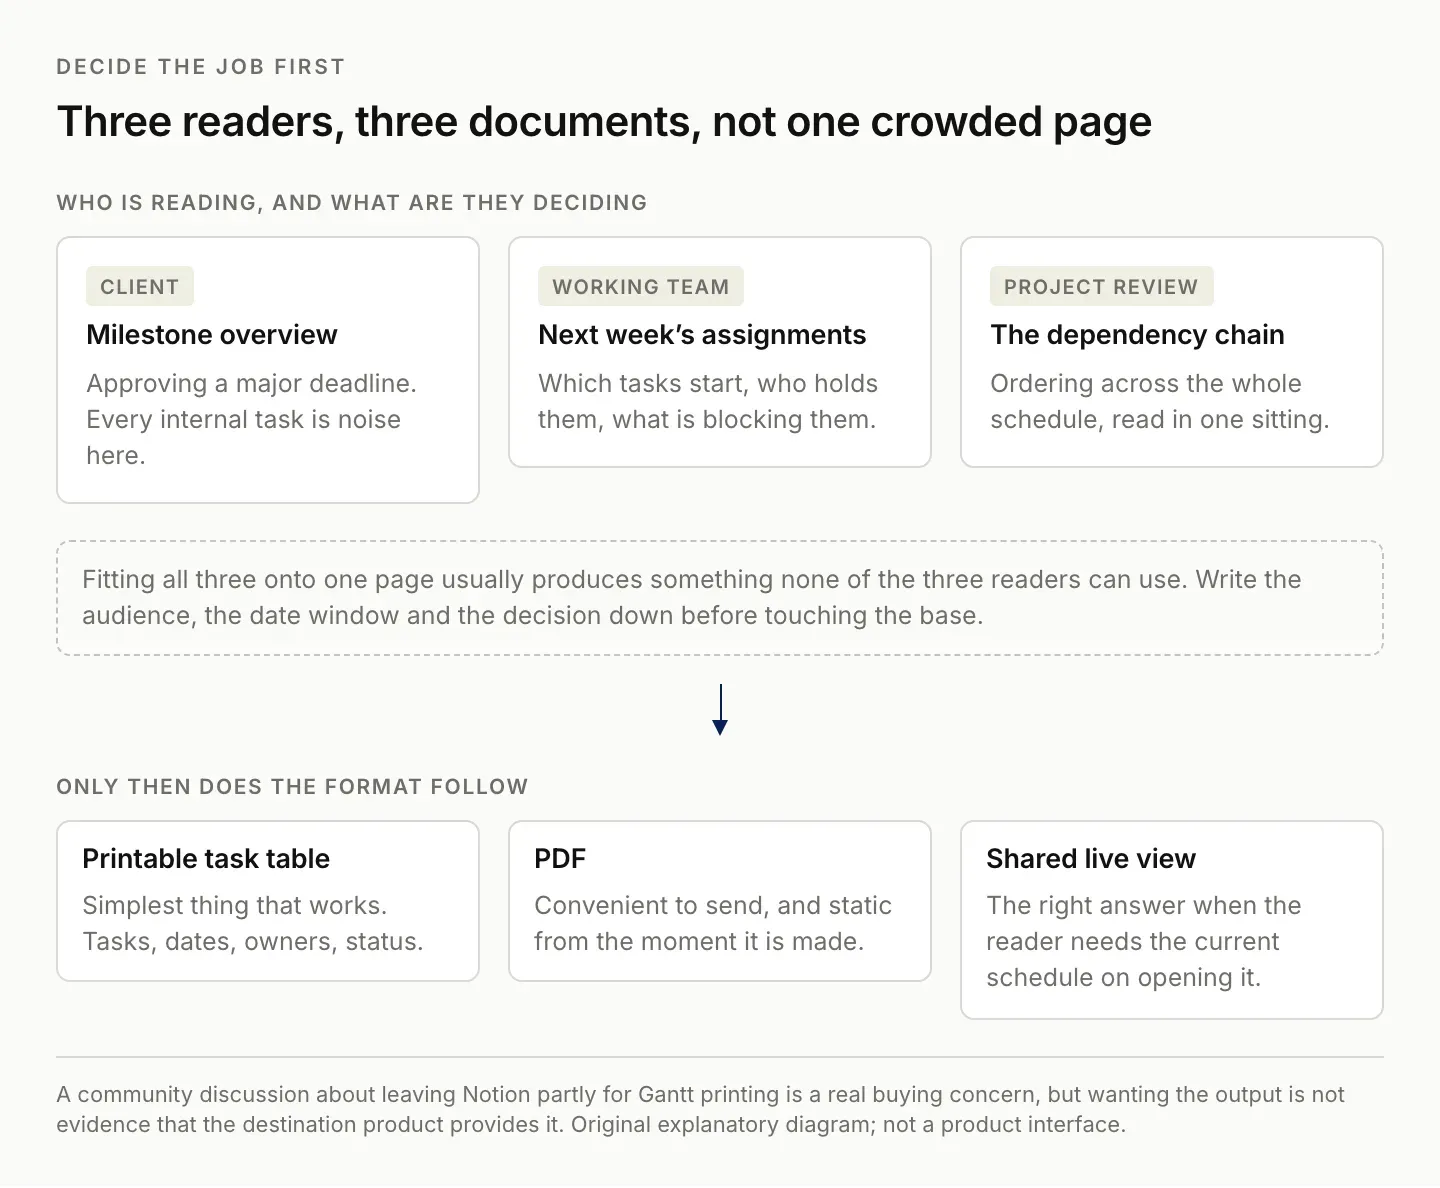
Audience, window and decision come first. The format is what falls out of them.
Check the date fields before exporting anything
Inspect the start date, end date, task label, and project relationship for the records you intend to report. A visual schedule can look plausible while containing missing dates or a task attached to the wrong project. Fix the source data before spending time on layout.
Airtable's Gantt documentation states that end dates are inclusive and that Gantt views do not account for timestamps. A task spanning January 1 through January 3 therefore occupies three calendar days in that view. Do not use a day-level Gantt as proof of an hour-level scheduling conflict.
For printed output, make the date interpretation explicit when it matters. State whether the schedule shows calendar days or working days. If your source contains timezones or time-of-day constraints, preserve that information elsewhere in the report instead of assuming the bar chart communicates it.
Check dependencies independently. A dependency indicates an ordering relationship; it does not prove that a person or resource is available for every overlapping task. Airtable documents milestones, dependencies, and critical paths as related Gantt concepts. Gantt dependency guide.
Use a small sample before preparing the full report. Include a one-day task, a longer task, a milestone if you use them, and a task with a predecessor. Those records help expose date and relationship mistakes that can disappear inside a dense project timeline.
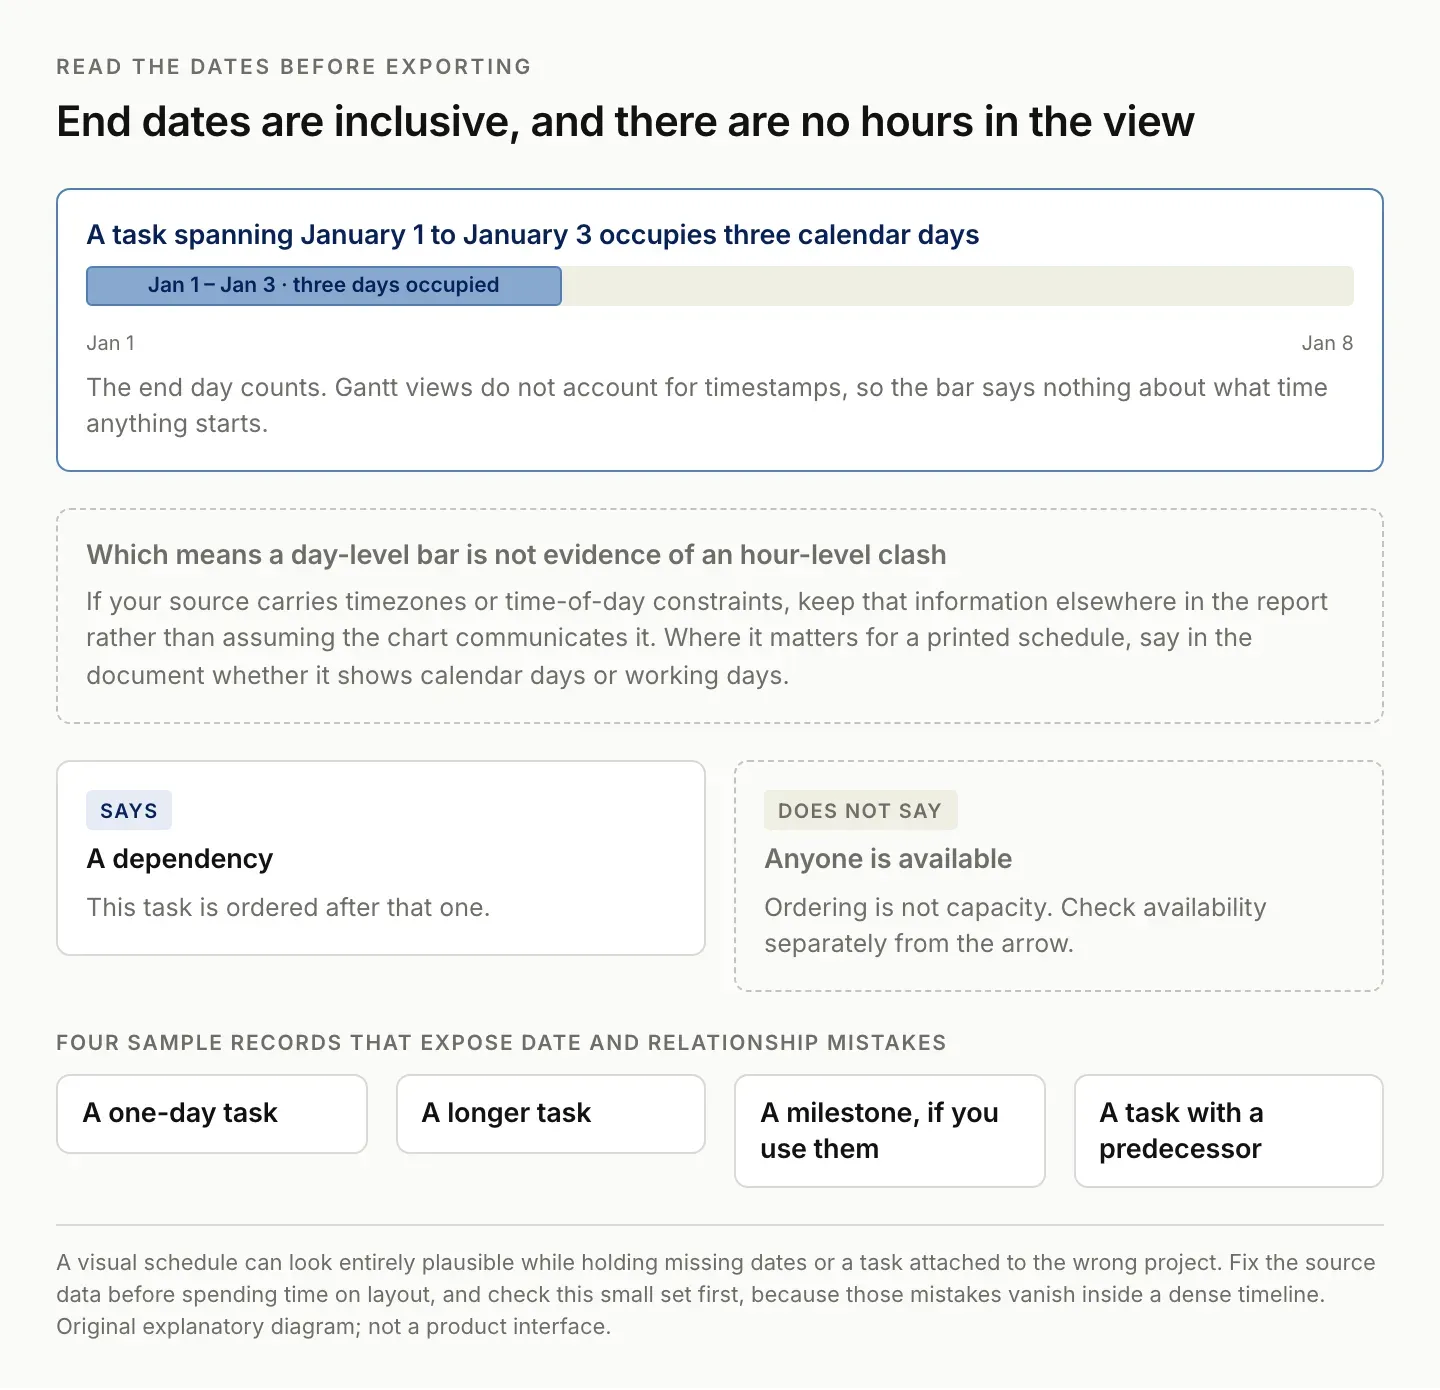
The end day counts, and there are no hours in the view. A day-level bar cannot evidence an hour-level clash.
Export the data when a task table is enough
If the reader only needs tasks, dates, owners, and status, export the relevant data and build a concise table. In the Gantt view's menu, Airtable documents a Download CSV option. Inspect the resulting file before formatting it; CSV is a data interchange format, not a screenshot of the timeline.
Confirm that the export contains the rows and columns you expected. Compare the first and last tasks with the source, check the date window, and inspect any blank dates. Keep a record of the view and export time so you can explain which snapshot the document represents.
Use a simple print layout with a project name, reporting window, revision date, and a manageable set of columns. Put the task name first and keep dates in a consistent format. A narrow status column can be useful, but do not let decorative fields crowd out the actual schedule.
For a longer list, repeat the column headings on later pages in your chosen spreadsheet or document tool. Inspect the final print preview, especially page breaks. A task name on one page and its date on another is a layout failure even when every value is technically present in the export.
Include a short note that the document is a snapshot and identify where the maintained schedule lives. That helps prevent a downloaded PDF from becoming an accidental competing source of truth when the project changes later.
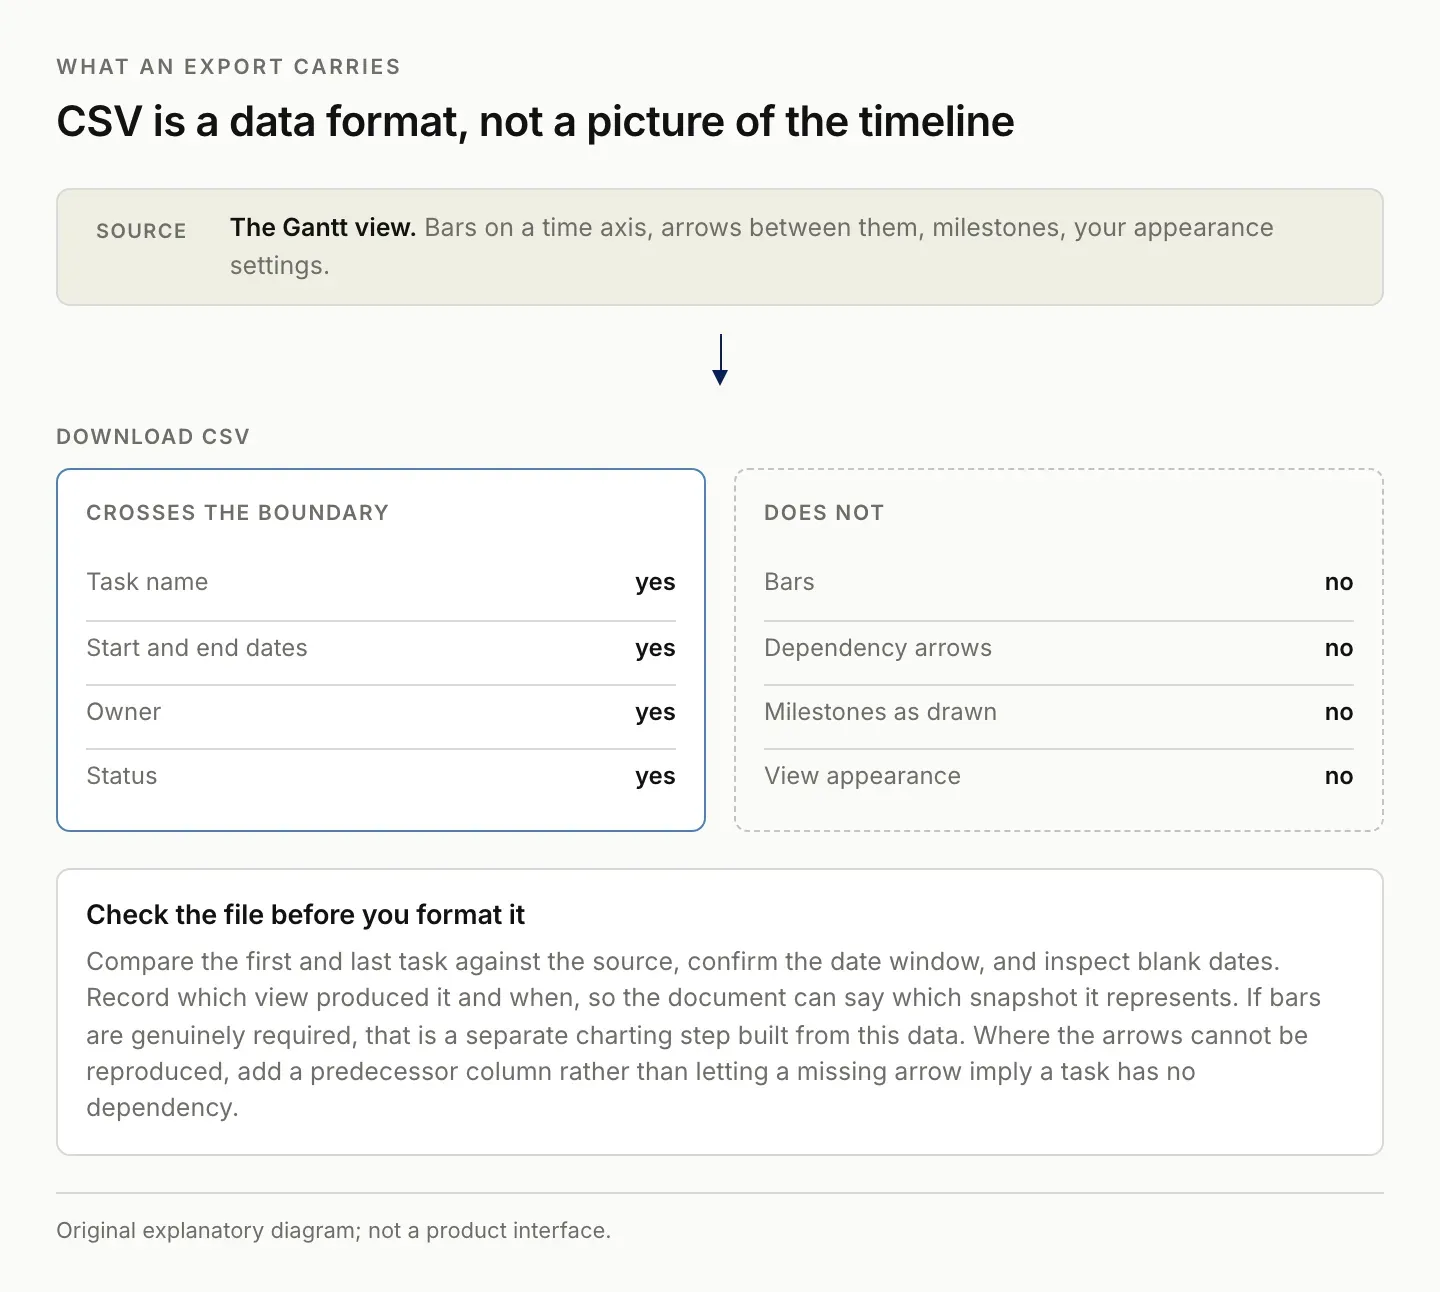
The export is the data behind the picture, not the picture. Recreating bars is a separate charting step.
Build a separate visual when bars are required
If the audience needs bars on a time axis, choose a reporting tool that can build that visual from the exported task data. Treat this as a separate charting step. Exporting CSV alone does not recreate Gantt bars, dependency arrows, milestones, or the exact appearance of the Airtable view. Zentor's Airtable integration page lists the Airtable connections currently available to an account.
Define the chart's start and end dates, then use a consistent scale. For a weekly handout, days may be appropriate. For a long project overview, weeks or months may be more legible. If changing the scale hides an important short task, show that task in an accompanying detail table.
Keep the task labels readable at the actual paper size. Reducing a six-month schedule to fit one small page can make it useless. Split the report by project or time window when necessary, and show the relationship between the sections with repeated titles and date ranges.
Preserve dependency information only if the reporting tool represents it correctly. If it does not, include a predecessor column or a separate blocker list. A missing arrow should not imply that a task has no dependency. Document the intentional simplification.
Airtable's appearance controls can help you prepare an on-screen view, but they do not turn the product into a guaranteed print-layout engine. Use the native customization guide for the available view settings and verify the exported or printed artifact separately.
Understand what Page Designer does and does not solve
Airtable also points to Page Designer for custom printable layouts. It is useful to investigate when your output resembles a formatted record or report. Do not assume that it automatically reproduces the entire Gantt visualization simply because it can produce printable pages. Page Designer overview.
Start with one representative record or reporting unit and build the layout you actually need. Check whether the required information can be presented clearly without excessive manual rearrangement. If the report depends on a wide time axis spanning many records, test that specific requirement before choosing the tool.
Compare the maintenance cost of the options. A custom layout that takes repeated manual work may be acceptable for an occasional client presentation but a poor fit for a daily site handout. A simple table may serve the recurring need better than a visually impressive chart that becomes stale.
Keep the generated file and its source snapshot together during review. If a reader finds an incorrect date, you should be able to determine whether the error came from the source, the export, or the layout. Without that trace, every correction becomes a reconstruction exercise.
Avoid promising automatic refresh unless the chosen reporting workflow actually provides it. A static PDF does not update when someone moves a task in Airtable. If the report is regenerated on a schedule, label each version and inspect the result before distribution.
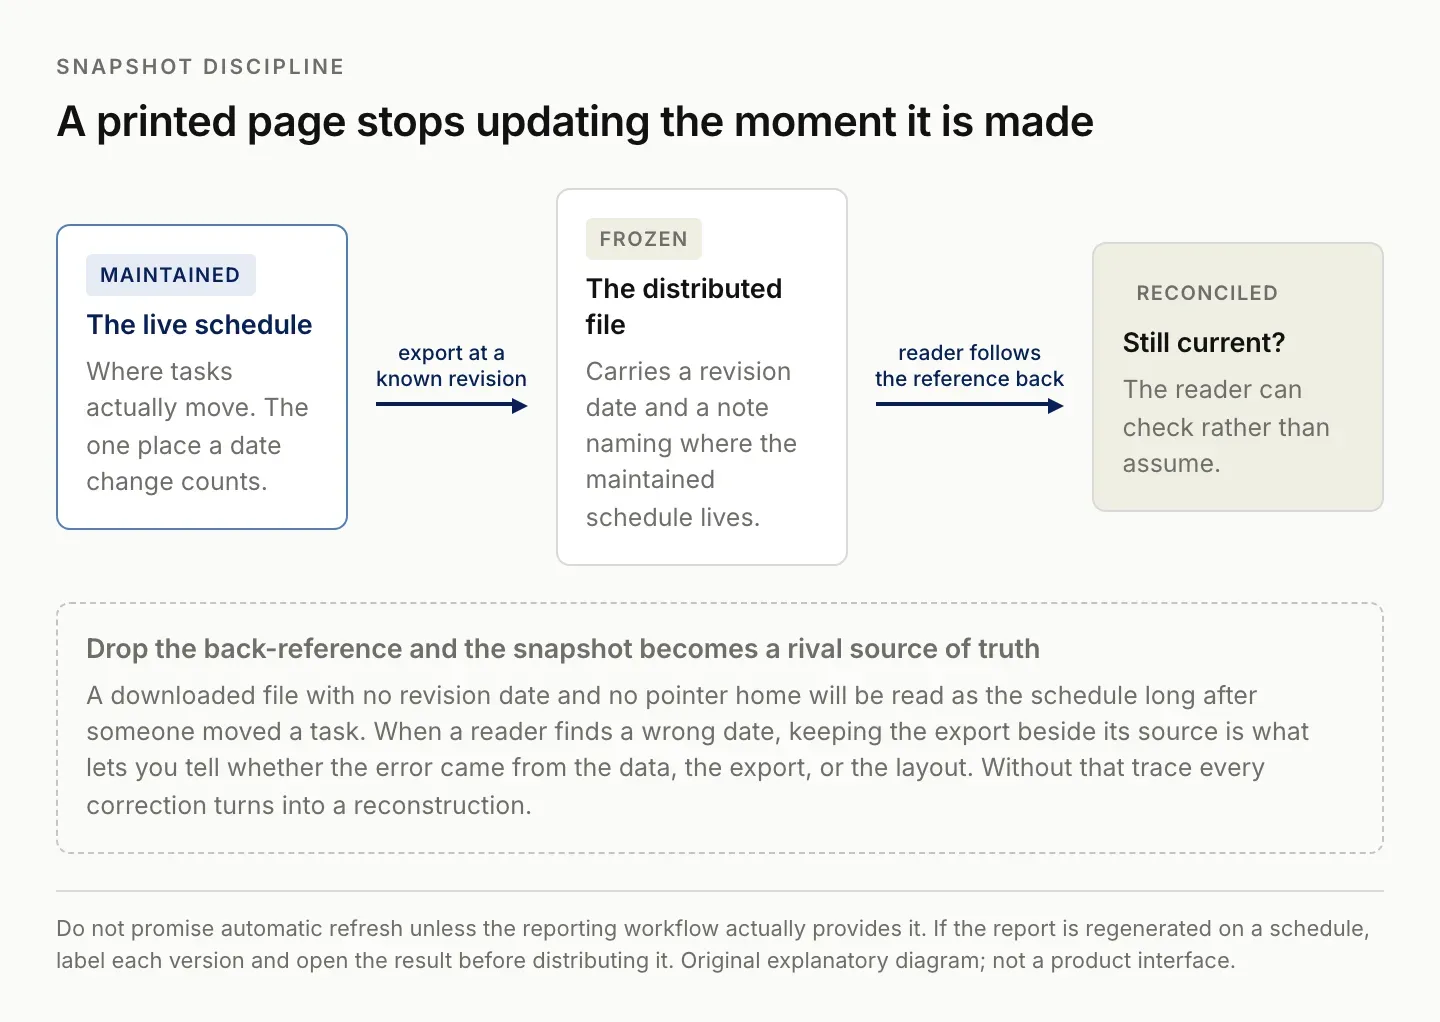
Without a revision date and a pointer home, a downloaded file quietly becomes a rival source of truth.
Test the output before switching from Notion
If you are considering moving from Notion because of timeline output, build a small representative trial in the destination first. Include your real structural requirements: multiple projects, recurring task patterns, dependencies, and the required print format. Use non-sensitive test data if you are evaluating in a separate workspace.
Notion provides timeline views and content export options, but the existence of PDF export does not guarantee that a particular timeline will print exactly as you need. Test the actual view and exported file. Notion timelines, Notion export guidance. The Notion vs Airtable comparison covers where each tool is the better home for this kind of record.
Write acceptance criteria before comparing the tools. For example: the output must show all selected tasks, retain the agreed date interpretation, remain readable at the chosen paper size, and identify its revision. Then evaluate the resulting document against those criteria rather than comparing marketing descriptions.
Include migration work in the decision. Relations, comments, attachments, formulas, and operating habits may need attention beyond moving a CSV. If the only missing requirement is a printable report, a separate reporting step might be less disruptive than rebuilding the whole project system.
Keep a working copy of the original system during a trial. Reconcile a small project end to end before expanding. The useful evidence is a correctly maintained schedule and a usable output, not merely a successful import message.
Where Zentor could help prepare the report
Zentor's intended role is to help produce recurring deliverables from the tools where your work already lives. For this problem, a useful workflow would assemble the selected schedule data, identify missing fields, and prepare a reviewable report with the source and revision clearly attached.
Specify the desired output in the brief: “Prepare a printable two-week task schedule from these approved records. Include task, owner, dates, and blockers. Keep missing dates visible, preserve the source record references, and return a draft for review.” If a visual Gantt is essential, say so explicitly and inspect the resulting chart.
Zentor is in early access. This guide does not claim that a particular Gantt export, PDF generator, or Airtable connection has been demonstrated in your account. Confirm the available workflow before depending on it for operational reporting. Explore Zentor with one representative schedule and a specific output requirement.
The acceptance standard remains the same regardless of which assistant prepares the file. Check completeness, dates, readability, and the actual saved artifact. A message saying the report is ready is not a substitute for opening it.
FAQ: printing and exporting an Airtable Gantt chart
Can I print an Airtable Gantt view directly?
The current Airtable Gantt FAQ says direct printing is unavailable. It suggests exporting data or using printable layouts instead. Test the alternative against the format you need.
Does a CSV export contain the Gantt chart?
No. It contains exported data. Recreating a graphical schedule requires a separate layout or charting step that interprets those fields.
Will moving from Notion fix printing?
Only if the destination passes your actual output test. Build a small representative schedule and inspect its final document before committing to a migration.
Can I use the printed chart as a live schedule?
A printed page is a snapshot. Include the revision and a reference to the maintained schedule so readers can check whether it is still current.

Zentor Editorial Zentor editorial team
The Zentor editorial team writes about workflow automation, AI agents, and the tools we build. Default byline for industry overviews, listicles, and collaborative pieces.
Ready to put this into practice?
Zentor runs browser tasks, research, and schedules automatically. Try it free.